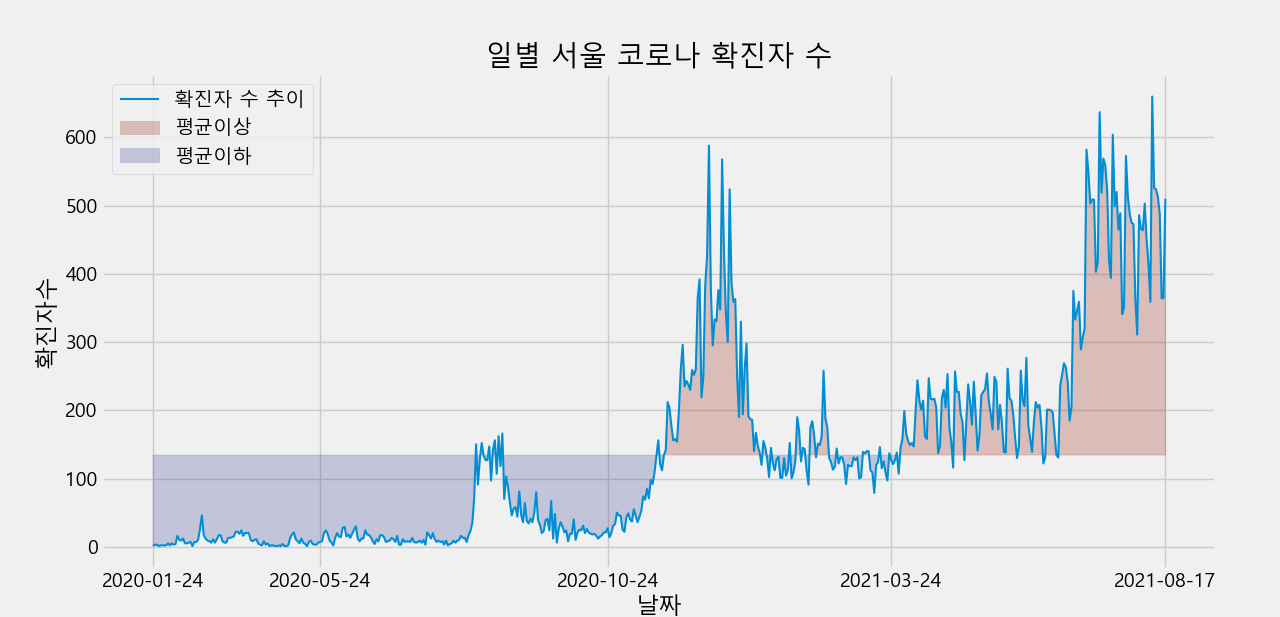
지금까지 배웠던 pandas와 matplotlib을 이용하여 서울 코로나 확진자 수를 그래프로 나타내 보았습니다.
row 값에 환자 한명의 정보가 나타나 있기 때문에 확진일을 이용하여 value_counts()를 사용해 일일 확진자의 수를 뽑았습니다.
xtick이 너무 많아서 '2020-01-24','2020-05-24','2020-10-24','2021-03-24','2021-08-17' 이렇게 다섯 날짜만 표시되도록 했습니다.
평균값을 중심으로 평균 이상과 평균 이하를 표현하기 위해 plt.fill_between을 사용했습니다.
선의 굵기의 기본값인 2는 너무 굵어서 1.5로 선의 굵기를 변경했습니다.
[전체 코드]
|
1
2
3
4
5
6
7
8
9
10
11
12
13
14
15
16
17
18
19
20
21
22
23
24
25
26
27
28
29
30
31
32
33
34
35
36
37
38
39
40
41
42
43
44
|
import pandas as pd
from matplotlib import pyplot as plt
plt.style.use('fivethirtyeight')
df = pd.read_csv("seoul_corona_now - seoul_corona_now.csv")
df['확진일'].value_counts()
중위값 = df['확진일'].value_counts().median()
평균 = df['확진일'].value_counts().mean()
일별확진자수 = {}
일별확진자수 = df['확진일'].value_counts()
print(일별확진자수)
날짜별확진자수 = []
날짜 = []
수 = []
Dick = 일별확진자수.to_dict()
날짜별확진자수 = sorted(Dick.items())
for key,value in 날짜별확진자수:
날짜.append(key)
수.append(value)
print(날짜)
print(수)
print('중위값 :',중위값)
print('평균 : ',평균)
plt.plot(날짜,수,label = "확진자 수 추이",linewidth = "1.5")
plt.xlabel("날짜")
plt.ylabel("확진자수")
plt.title("일별 서울 코로나 확진자 수")
plt.fill_between(날짜,수,평균,where=(수 > 평균),interpolate=True, alpha = 0.25,color = "#9a2118",label = "평균이상")
plt.fill_between(날짜,수,평균,where=(수 <= 평균),interpolate=True, alpha = 0.25,color ="#3c479c",label = "평균이하")
plt.legend()
plt.xticks(['2020-01-24','2020-05-24','2020-10-24','2021-03-24','2021-08-17'])
plt.show()
|
cs |
728x90
'데이터분석 > 분석 예제' 카테고리의 다른 글
| <React> 공공데이터 API 불러오기(한국도로공사 OpenAPI) (0) | 2021.11.17 |
|---|---|
| 서울 코로나 요일별 확진자 비율 (2020.01.24~ 2021.08.17 ) (0) | 2021.08.27 |
| <Python> 워드 클라우드 만들기 (0) | 2021.08.04 |