728x90
1. 막대 그래프를 사용할 때 x축에 글자 수가 많다면 서로 겹쳐져서 가시성이 크게 떨어지는 경우가 있습니다.
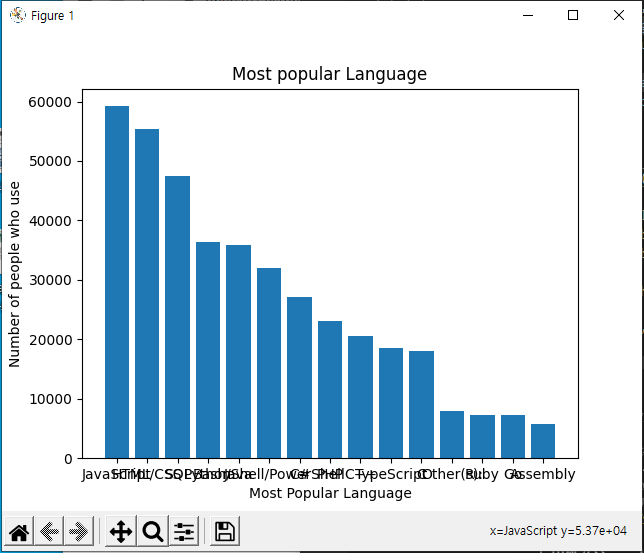
이럴때는 x,y축을 바꿔서 바를 눕힌 가로바를 이용하면 좀 더 가시성을 회복할 수 있습니다.
기존은 세로 바 그래프를 만들기 위해서 plt.bar()를 사용했다면 가로로 눕히기 위해서는 plt.barh()를 사용해 주시면 됩니다.
|
1
2
3
4
5
6
7
8
9
10
11
12
13
14
|
from matplotlib import pyplot as plt
language = ['JavaScript', 'HTML/CSS', 'SQL', 'Python', 'Java', 'Bash/Shell/PowerShell', 'C#', 'PHP', 'C++', 'TypeScript', 'C', 'Other(s):', 'Ruby', 'Go', 'Assembly']
popularity = [59218, 55465, 47544, 36442, 35916, 31991, 27097, 23030, 20524, 18523, 18017, 7920, 7331, 7201, 5833]
plt.barh(language, popularity)
plt.title("Most popular Language")
plt.ylabel("Number of people who use")
plt.tight_layout
plt.show()
|
cs |
[실행결과]
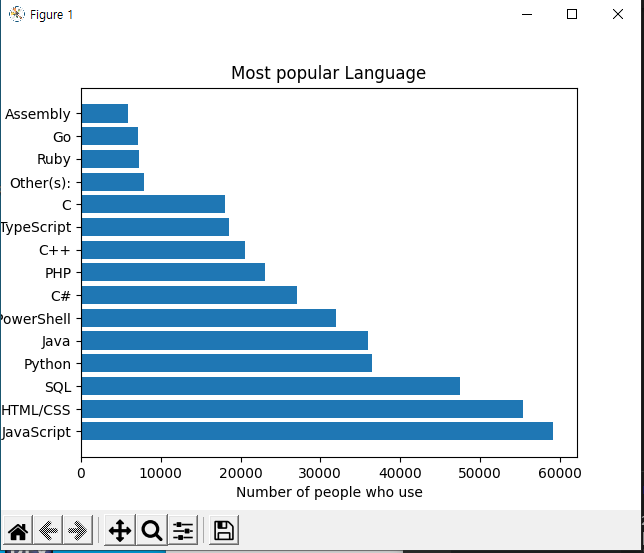
만약 가장 큰 값부터 아래로 내리고 싶다면 먼저 리스트를 거꾸로 뒤집는 list이름.reverse()를 사용해주시면 됩니다.
주의하실 점은 reverse를 실행해 줘야 하기때문에 ()를 반드시 붙여주셔야합니다.
|
1
2
3
4
5
6
7
8
9
10
11
12
13
14
15
16
17
|
from matplotlib import pyplot as plt
language = ['JavaScript', 'HTML/CSS', 'SQL', 'Python', 'Java', 'Bash/Shell/PowerShell', 'C#', 'PHP', 'C++', 'TypeScript', 'C', 'Other(s):', 'Ruby', 'Go', 'Assembly']
popularity = [59218, 55465, 47544, 36442, 35916, 31991, 27097, 23030, 20524, 18523, 18017, 7920, 7331, 7201, 5833]
language.reverse()
popularity.reverse()
plt.barh(language, popularity)
plt.title("Most popular Language")
plt.ylabel("Number of people who use")
plt.tight_layout
plt.show()
|
cs |
[실행결과]

728x90
'데이터분석 > Python matplotlib' 카테고리의 다른 글
| <Python Matplotlib> Stack Plot 누적 그래프 그리기 (0) | 2021.08.20 |
|---|---|
| <Python matplotlib> Pie chart 만들기 (0) | 2021.08.17 |
| <Python matplotlib> matplotlib 한글 폰트 깨짐 수정[진짜 되는 수정] 따라만 하세요 (0) | 2021.08.16 |
| Python matplotlib 사용하기 2. 막대 그래프 (0) | 2021.08.08 |
| <Python matplotlib> 기본적인 선그래프 만들기 (0) | 2021.08.05 |